CANADIAN HOUSING PT. 2
Reviewing Mortgage Statistics
June 21, 2024
Click here to download the PDF version
RE-VISITING THE CANADIAN HOUSING MARKET
We last wrote about Canadian housing almost three years ago. Our belief was that there would eventually be a crisis if prices continued to rise and a crisis if prices went down. Two ways to lose, zero ways to win. We hypothesized this dynamic would cause increased social tension culminating in a generational divide between the haves and have-nots. Our views since then have not meaningfully changed.
A recent tweet from the Bank of Canada caught our attention. We find it curious that the official Bank of Canada account with 247.8K followers would quote tweet an anonymous account with only 19.8K followers by comparison to announce an error correction in previously published data. The tweet can be found here.
This suggests two things. First, those voicing negative views on the housing market are clearly getting a lot of attention from government officials. Second, the decision to quote tweet a much smaller account to correct the record indicates to us that managing optics and massaging the narrative has become extremely important. Almost as if the fundamentals don’t quite add up, policy makers recognize they have run out of conventional options and thus embraced the persuasion game to influence herd mentality.
Below we will explore the state of the housing market using charts and statistics from the Bank of Canada website, linked here. Our commentary pertaining to the data itself will be limited.
BANK OF CANADA - INDICATORS OF FINANCIAL VULNERABILITIES STATISTICS
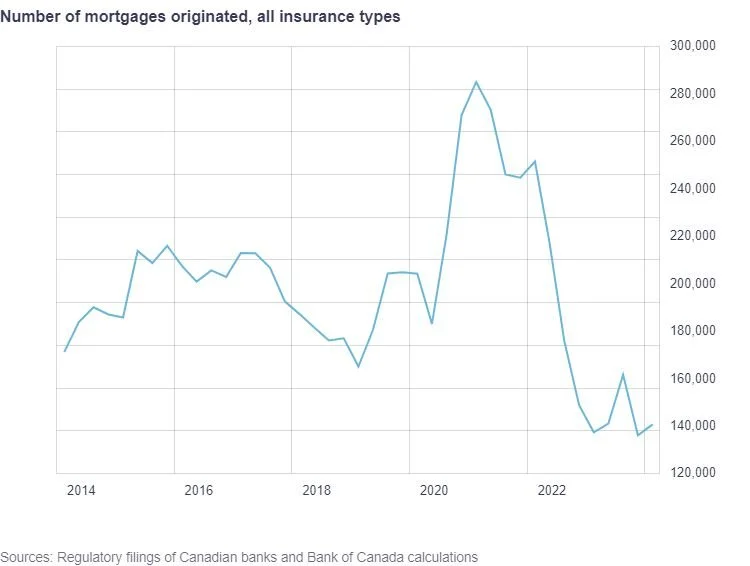
Number of mortgages originated all insurance types.
Q1 2021 – 285,272
Q1 2024 – 140,896
Share of new mortgages (%), all insurance types, by type of interest rate and term.
Q1 2022
54.2 Variable rate (~1.44%)
10.8 Fixed rate, term of less than 3 years
9.7 Fixed rate, term of 3 to less than 5 years
25.3 Fixed rate, term of 5 years or more (~2.99%)
Q1 2024
4.2 Variable rate (~6.62%)
20.1 Fixed rate, term of less than 3 years
50.2 Fixed rate, term of 3 to less than 5 years
25.4 Fixed rate, term of 5 years or more (~5.25%)

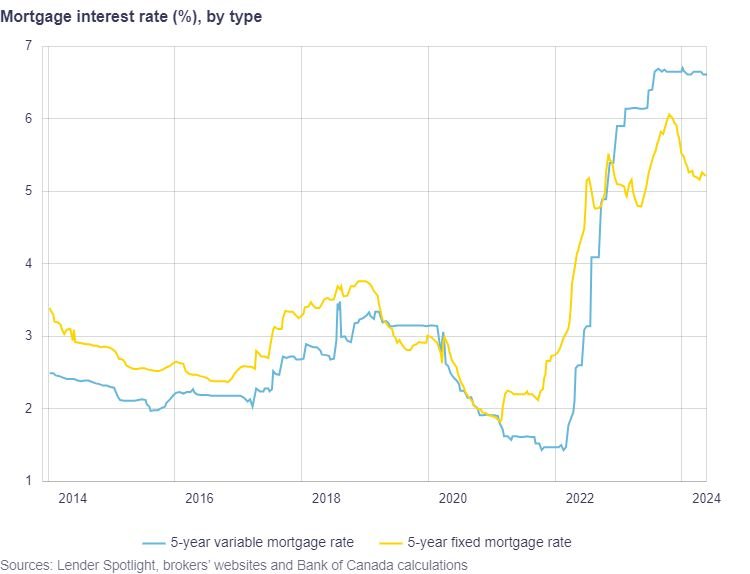
Variable rate mortgages comprised 54% of new issues in Q1 2022 at an interest rate of ~1.44% compared to only 4% of new issues in Q1 2024 at an interest rate of ~6.62%. Fixed rate, term of 5 years or more remained relatively constant at 25% of new mortgages issued throughout these years. Interestingly, the spread between the variable rate and fixed rate were historically large in opposite directions during these quarters.
Share of new mortgages (%), all insurance types, by amortization period.
Q2 2018
30.4 Longer than 25 years
54.1 25 years
15.5 Shorter than 25 years
Q1 2024
48.8 Longer than 25 years
39.6 25 years
11.6 Shorter than 25 years
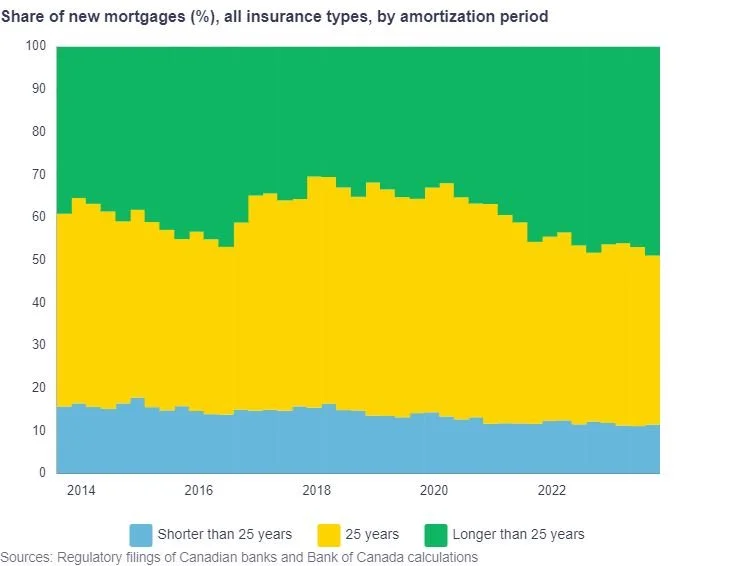
Less than one-third of new mortgages had an amortization period longer than 25 years in 2018 versus almost one-half in the most recent quarter.
Mortgage Debt Service Ratio
Bank of Canada calculates and describes mortgage debt service ratio as follows (emphasis added):
“The mortgage debt service ratio (DSR) measures the share of income a homebuyer dedicates to their mortgage debt payments. All else being equal, a household that spends a large portion of its income on mortgage payments may be more vulnerable to financial stress — it may be more likely to fall behind on debt payments if a negative income shock or a rise in mortgage interest rates were to occur. The Bank uses the share of new mortgages with a mortgage DSR greater than 25% to identify the most vulnerable households.”
Share of new mortgages (%) with a mortgage DSR (debt service ratio) greater than 25%.
Q4 2021 - 12.9
12.4 First-time homebuyer
13.5 Repeat homebuyer
7.7 Investors
Q1 2024 - 33.6
49.0 First-time homebuyer
38.1 Repeat homebuyer
26.2 Investors

By definition, the Bank of Canada considers households with a mortgage DSR greater than 25% as financially vulnerable, meaning they are at risk of missing payments in the event of a negative income shock and/or rising interest rates.
During Q4 2021, only 12.4% of first-time homebuyers and 13.5% of repeat homebuyers were issued new mortgages at a DSR high enough to categorize their household as financially vulnerable. However, just over two years later, these percentages skyrocketed to 49.0% (!) and 38.1% (!), respectively.
Median mortgage DSR (%), by type of homeowner.
Q4 2021 - 16.0
18.7 First-time homebuyer
16.9 Repeat homebuyer
12.2 Investors
Q1 2024 - 20.1
24.8 First-time homebuyer
22.1 Repeat homebuyer
17.8 Investors

Median mortgage DSR (%) statistics paint an even bleaker picture. The median first-time homebuyer is considered vulnerable to financial stress and, despite rising real estate prices, somehow the median repeat homebuyer is basically right at that threshold as well. This means, excluding investors, the median Canadian is considered finally vulnerable and at real risk of missing mortgage payments if any negative shocks occur.
Ratio of sales to new listings (%), all of Canada.
January 2021 ~87%
May 2024 ~53%

IF, THEN
Investing opportunities commonly resemble “IF-THEN” statements. If A happens, then outcome X will occur. If B happens, then outcome Y will occur. For example, if a company beats and raises guidance, then the stock price will go up. Or if inflation data comes in lower than expected, then stocks will rally.
Problems arise when analysis becomes overly focused on the “IF” part of the statement while the “THEN” portion is mistakenly overlooked and taken for granted. The consensus narrative back in 2016 was that if Trump was elected, then stocks would tank. We predicted a Trump victory, so we bought put options. Futures briefly sold off on election night, rallied quickly thereafter, and the options expired worthless.
We can’t help but notice conceptual similarities with Canadian housing. If the Bank of Canada cuts interest rates, then housing prices would go up. Mathematically, it makes sense. It’s Finance 101. Lower mortgage rates mean buyers can spend more on the principal without changing the monthly payment.
Except, it’s almost as if prospective sellers collectively anticipated rising prices and the housing market was met with a tidal wave of supply when the Bank of Canada finally lowered interest rates. A large supply shock without a commensurate demand shock is Economics 101. As seen in the chart above, the ratio of sales to new listings is languishing around the ten-year lows.
Housing prices are in bubble territory by most objective metrics relative to other developed nations throughout history and Canadian homeowners appear more stretched than ever before. Perhaps housing prices can remain elevated indefinitely. Perhaps not. But we would bet good money that IF policymakers cannot walk the narrow tightrope from the corner they’ve painted themselves into, THEN things are going to get really ugly, really quicky.