FY 2022
Kinsman Oak Investor Letter FY 2022
February 23, 2023
Click here to download the PDF version
REVIEW OF 2022 & PREVIEW OF 2023
Coordinated monetary and fiscal responses to Covid-19 fueled numerous bubbles over the past three years. Manias were not confined to one particular industry (the Dot-com bubble) or asset class (the housing bubble). Rather, they were everywhere. Parabolic moves occurred in worthless cryptocurrencies, bankrupt rental car companies, barely solvent brick-and-mortar retailers, and SPAC pump-and-dumps. The tide has officially rolled out.
Most of the carnage for these low-quality, highly speculative risk assets occurred in 2021 but last year was different and proved to be extremely challenging for even the safest financial assets. For example, 2022 was the worst year on record for “risk-free” 30-Year U.S. Treasuries which were down -33%, and the traditional 60/40 portfolio fell -24%, the worst return since 1930.
Relatively speaking, the stock market remained surprisingly resilient last year. Hypothetically, if you possessed omnipotent knowledge and had perfect foresight of the following key statistics at the beginning of 2022, would you have guessed the S&P 500 would only be down -18% on the year?
Fed Funds would increase +420 basis points from 0.1% to 4.3%.
10-Year yields would start the year at 1.5%, peak at 4.3%, and finish the year at 3.9%.
Headline CPI would average ~8% throughout the year.
U.S. Mortgage Rates would climb from 3.3% at the beginning of the year and peak at 7.2%.
And, most importantly, the market leading “FAANGMT” stocks were down on average -46.2% (!)
This -18% decline occurred while FY22 earnings expectations decreased by -2%. In our opinion, this suggests multiple compression related to rising rates and tighter financial conditions is likely in the rear-view mirror and now the risk of declining earnings expectations due to worse economic backdrop will come to the forefront. The more pertinent question is: How much of that is currently priced into valuations today?
Other high-profile losers over the past couple of years include companies that share many common characteristics such as Peloton, Beyond Meat, Carvana, Coinbase, Wayfair, MicroStrategy, too many SPACs to count, and so forth. The painful unwind of what we call the Magical Thinking Zeitgeist is a natural consequence of severe ZIRP-fueled misallocation of capital. We believe this will continue as long as financial conditions remain tighter.
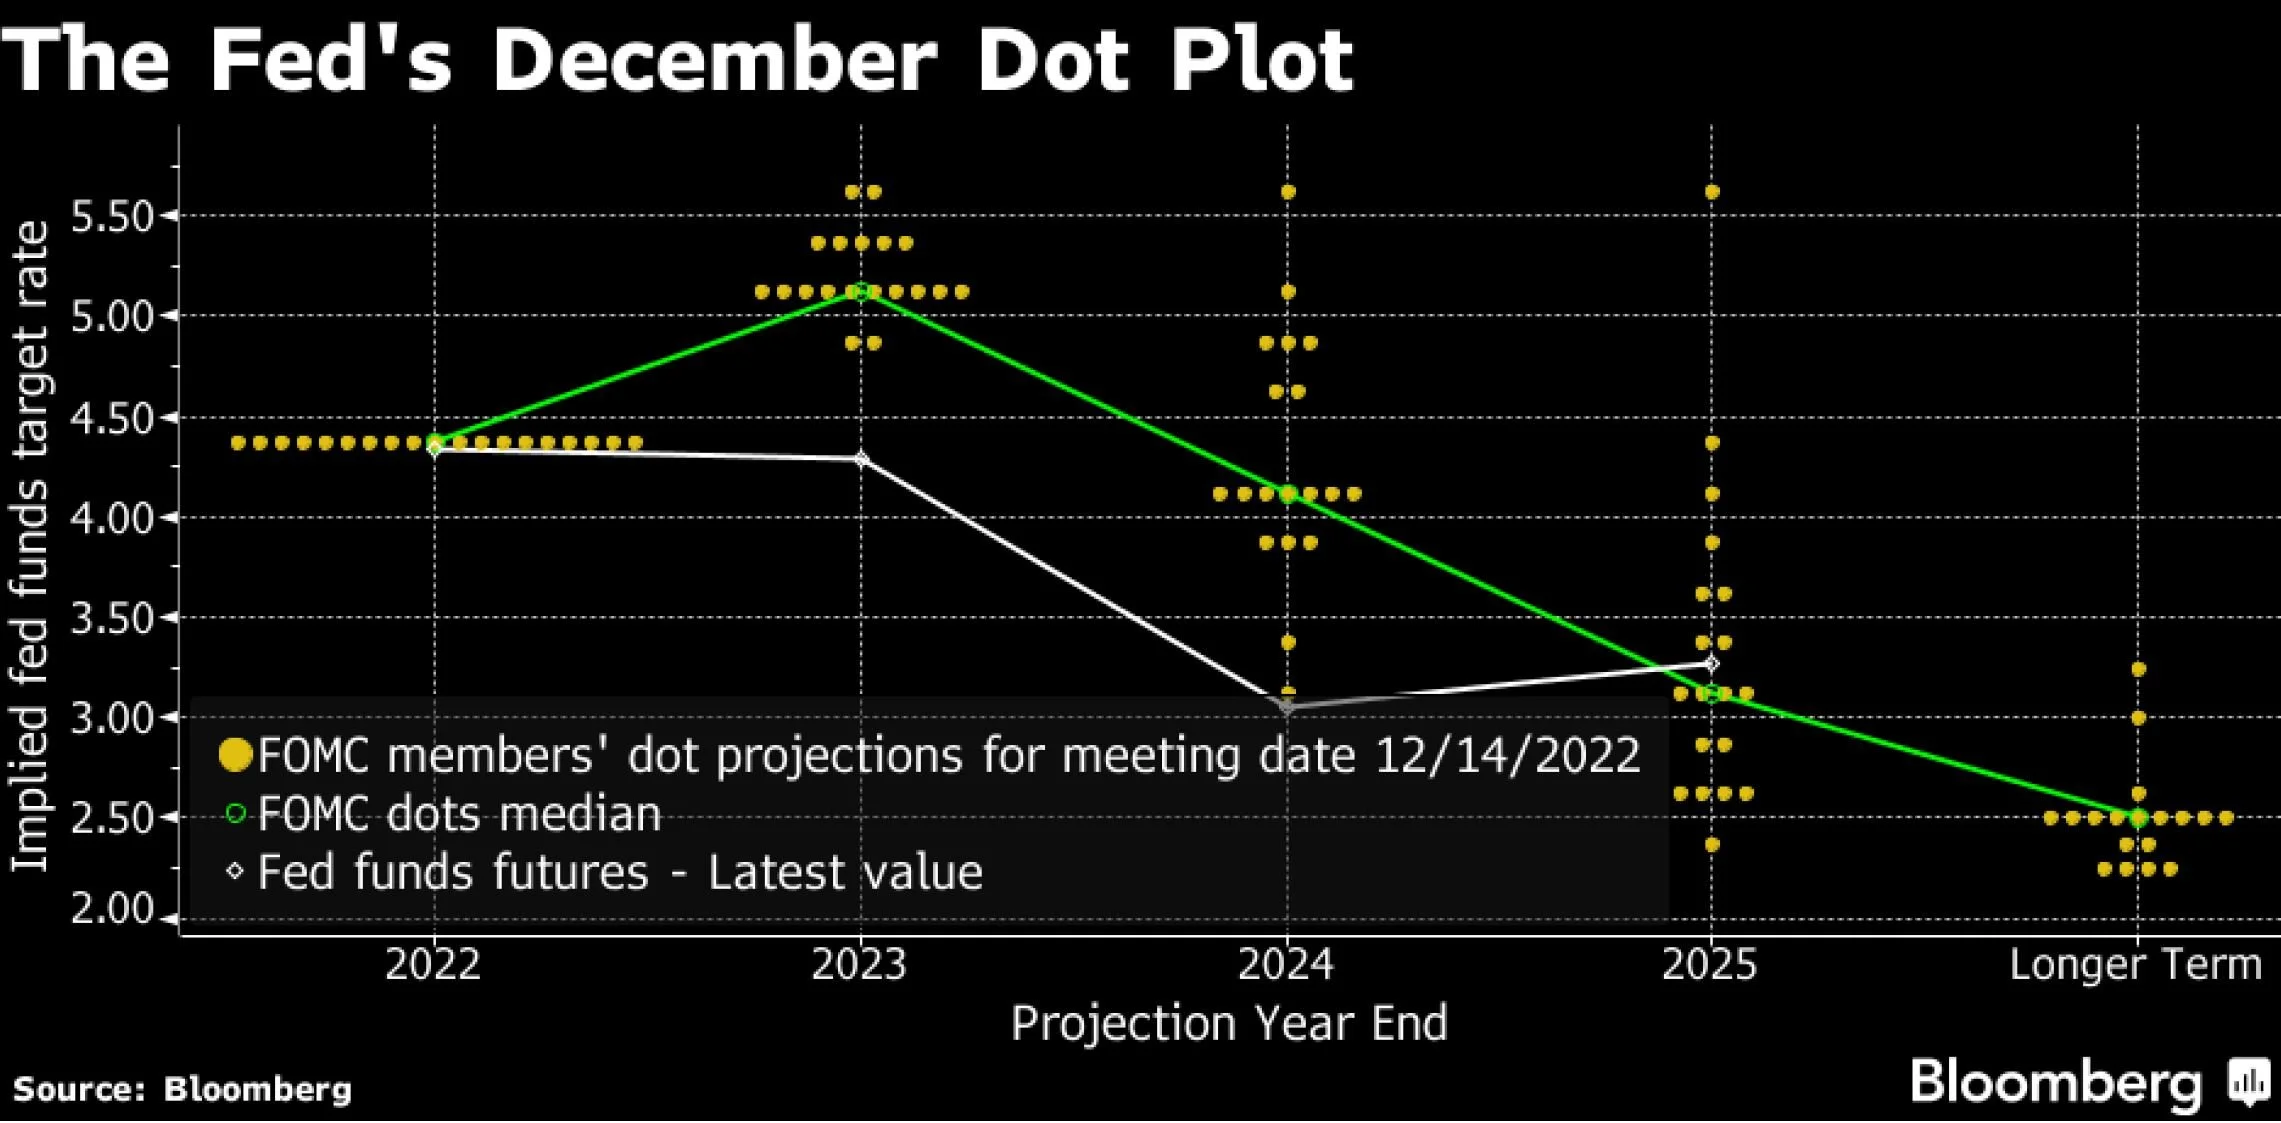
Monetary and fiscal policy work with lag. If the 2021 economy was a product of excessive easing in 2020 then it stands to reason the 2023 economy will likely be a product of the rapid tightening in 2022. Gauging how much is priced into equity valuations is much more interesting and complicated question. At this juncture, it appears the market does not expect interest rates to remain higher for longer despite what the Fed insists (Appendix A), and investors believe recent earnings are largely sustainable (more on this later).
Higher For Longer Is a Problem
The Federal Reserve remains adamant about maintaining a ‘higher for longer’ interest rate policy and, even though market participants don’t believe their jawboning, it’s worth exploring what financial markets may look like if the central bank’s bite matches its bark. Our belief is the full effects of previous tightening have not yet been felt.
Despite the strong year-to-date rally, it’s important to remember that decelerating the pace of rate hikes is not the same thing as pausing rate hikes altogether. Likewise, pausing rate hikes is not the same thing as cutting rates. Investors appear to be overly focused on the timing of when the last rate hike of this cycle will occur, but the duration of the subsequent pause will be far more important for the economy and the stock market, in our view.
The effects of rising interest rates are not immediate, and we believe a higher for longer policy stance will pose serious problems for economic growth. The longer interest rates remain elevated, the more economic activity will be supressed. Month after month, corporations will be refinancing outstanding debt at higher fixed interest rates, and this creates a multi-year headwind for earnings growth. Cash flow to re-invest back into the business is incrementally lower since more dollars are being allocated to interest expense.
Individuals will experience higher interest rates on loans such as credit card debt or refinanced mortgages, ultimately resulting in headwinds to consumer spending. A larger percentage of their budget will be allocated toward debt service costs instead of consumption. In a vacuum, each of these consequences may seem insignificant on their own, but it begins to add up quickly.
Certain businesses were only viable at a zero cost of capital. Companies that need to tap into capital markets to sustain operating losses (zombies and faux unicorns) can’t exist in a higher for longer environment without sacrificing growth and/or re-engineering their business models. Turns out, selling products and services below cost is not disruption or innovation, after all. The word “moat” doesn’t mean what it used to and there is a real cost to financial illiteracy when rates are above zero.
Hard Versus Soft Landing
Expectations of a soft landing have gathered steam and buoyed risk assets over the past few months. Ironically, a rising stock market on the back of soft landing hopes will only embolden central bankers to maintain a restrictive for longer policy stance. Loosening financial conditions prematurely would risk undermining their fight against inflation and, as long as stocks stay elevated, there is no reason to do so with an aggressive pivot.
It’s worth noting, the early stages of every recession always look like a soft landing (Appendix B). Growth decelerates and inflation cools simultaneously, but neither does so to such a degree that would cause concern yet. Investors and central bankers myopically accept the soft landing narrative with a warm embrace. Sound familiar? Eventually growth craters, central banks begin easing aggressively, and a recession takes place.
In our opinion, soft landings by definition require pre-emption, and that shipped sailed long ago. The Fed insisted inflation was transitory and waited far too long to tighten financial conditions. Hiking rapidly in a catch-up phase means getting to neutral without overshooting is virtually impossible. Snip-snapping from too accommodative to too restrictive invites elevated stock market volatility, sporadic inflation, and boom-bust cycles… All characteristics of a hard landing, especially if the Fed is determined to maintain this restrictive policy stance until coincident and/or lagging economic indicators roll over.
Year-to-Date Rally - Signal or Noise?
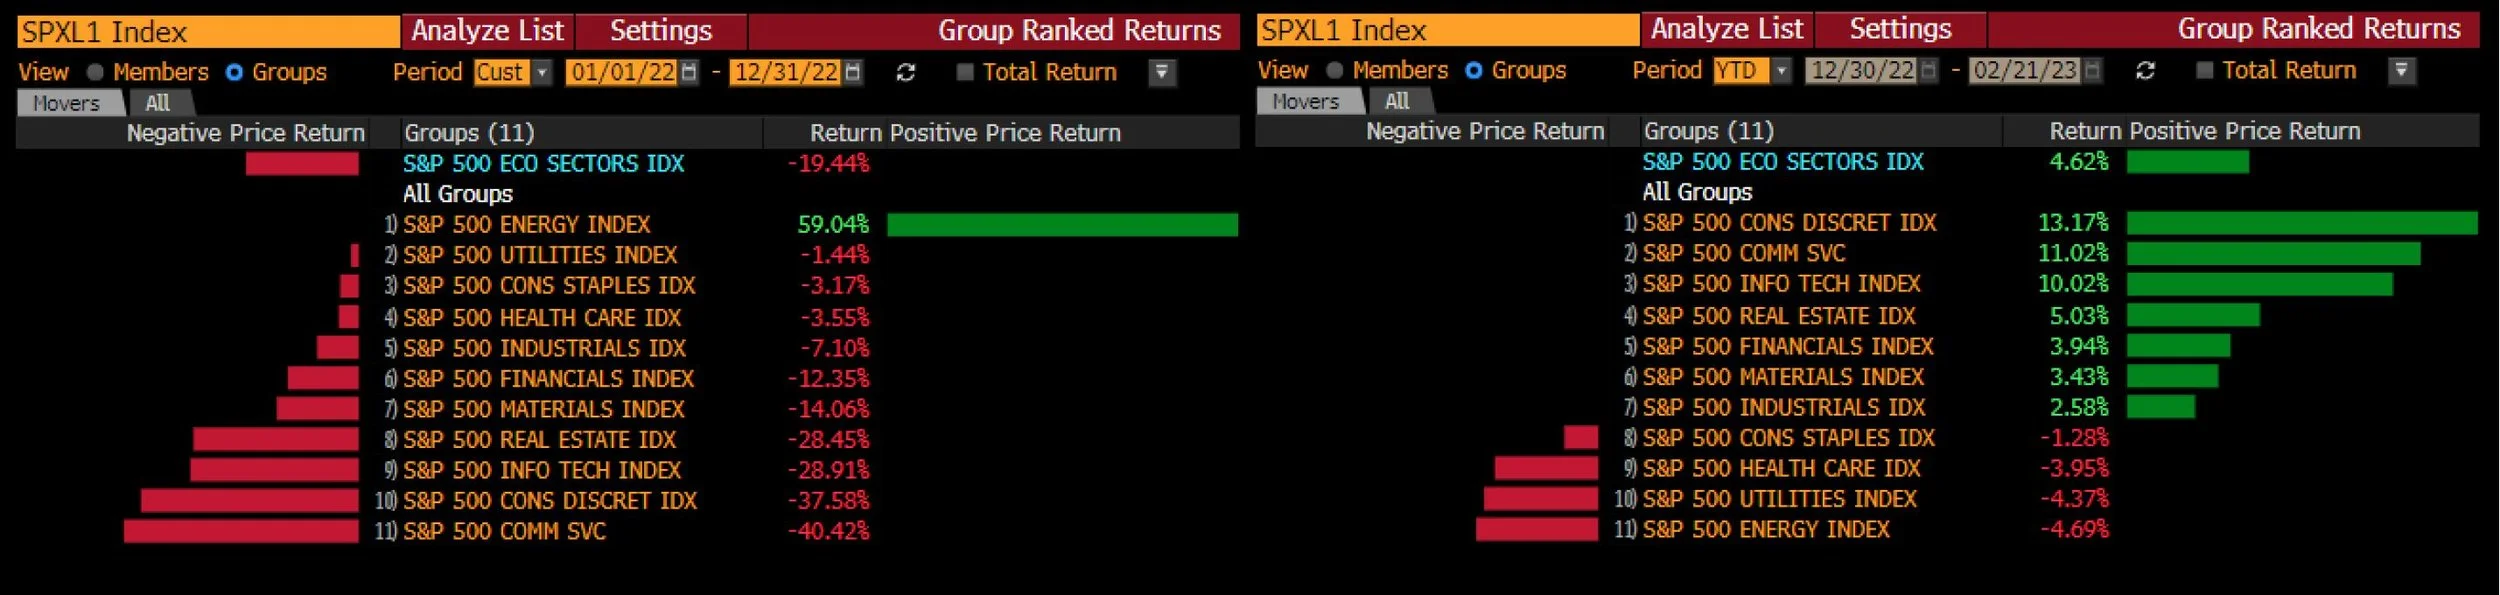
In a word, the year-to-date rally has been remarkable. Unprofitable technology companies and meme stocks have seen an eye-popping resurgence thus far, and the extent of short covering has been almost unprecedented. In fact, when sorted by sector, last year’s biggest losers are this year’s biggest winners in practically exact reverse order, and vice-versa (Appendix C). It’s worth exploring whether this price action is signal or noise. In other words, is it indicative of a new sustainable bull market or just another bear market bounce?
The short answer is no one can really say for sure. But throughout last year stock market volatility remained elevated and uncertainty surrounding the terminal Federal Funds Rate was high. The combination of higher volatility, higher terminal rate uncertainty, and higher interest rates disproportionately impacted certain sectors and types of stocks. This, along with tax loss selling, created severely oversold conditions for large pockets of the market.
All of a sudden things changed. We received a couple of disinflationary CPI prints, the bond market rallied, and Powell sounded more dovish than investors were expecting. Volatility continued to trend lower, and the biggest losers were turning into the biggest winners. Our belief is this bout of risk-on behaviour has primarily been driven by leveraged (and valuation-insensitive) quantitative trend followers. Lower volatility means additional leverage, so buying begets even more buying. This self-reinforcing dynamic would explain why heavily shorted, unprofitable technology, illiquid, and meme stocks have gone straight up.
Historically, secular bull markets require a combination of (a) Expanding valuations and (b) Sustainable earnings growth to persist. We are not convinced either of those conditions are present today. The S&P 500 trades at ~18.5x forward EPS, making the case for higher valuations difficult. Meanwhile, economic growth was anemic in real terms during the 2010s, despite ultra-low interest rates. If rates stay higher for longer it’s difficult to imagine GDP growth being higher this decade than the previous one, especially with a higher outstanding debt load as well. Markets are unpredictable, but we would be surprised to experience another secular bull market so soon.
Key Themes from Recent Earnings Reports
Companies have generally reported better than feared Q4 numbers and issued annual guidance that does not imply revenue growth or earnings will fall off a cliff this year. Investors have interpreted this as good news and, relatively speaking, it is much better than the trainwreck many were expecting. This combined with the more quantitative dynamics of the rally have propelled many stocks higher than we would have imagined.
After analyzing recent company filings and reading through earnings call transcripts, the following three themes have become evident thus far: (1) Revenue growth has been derived from higher prices and offset by lower volumes, and (2) COGS growth has vastly outpaced sales growth, and (3) Cost cutting initiatives have taken centre stage, particularly at companies with bloated cost structures.
The first theme suggests recent revenue growth is unsustainable. Companies can only hike prices on products/services so much before volume declines offset the effect on top-line revenue growth completely. Further, COGS growth outpacing sales growth means inventories will begin to climb quickly, possibly leading to more promotional activity in the quarters ahead. Ultimately, both themes combined may result in significant operational deleveraging, pressuring margins more than investors realize. Companies that struggle to cut costs quickly as pricing power and/or demand erodes will be most negatively impacted.
This brings us to our third theme which is major cost cutting initiatives are being emphasized on earnings calls. Layoffs have become increasingly common over the past few months and management teams are focused on stretching each dollar of operating expenses. Improving marketing spend efficiency and boosting employee productivity are mentioned often. Management teams who were previously fervent supporters of work from home are now attempting to get their workforce back into the office in a bid to increase output despite a lower headcount.
WHERE WE SEE OPPORTUNITY
In our opinion, there are top-down reasons to be bearish but sentiment and bottom-up reasons to be selectively bullish. We have already described the challenging macroeconomic backdrop to remain cautious. Further, expected forward EPS growth has just gone negative and, if prior experience is any indication (2001, 2008, 2015, 2020), equities experienced significant downside after expected growth inflects from positive to negative territory. Monetary policy remaining hawkish in the context of an earnings recession suggests more caution is warranted.
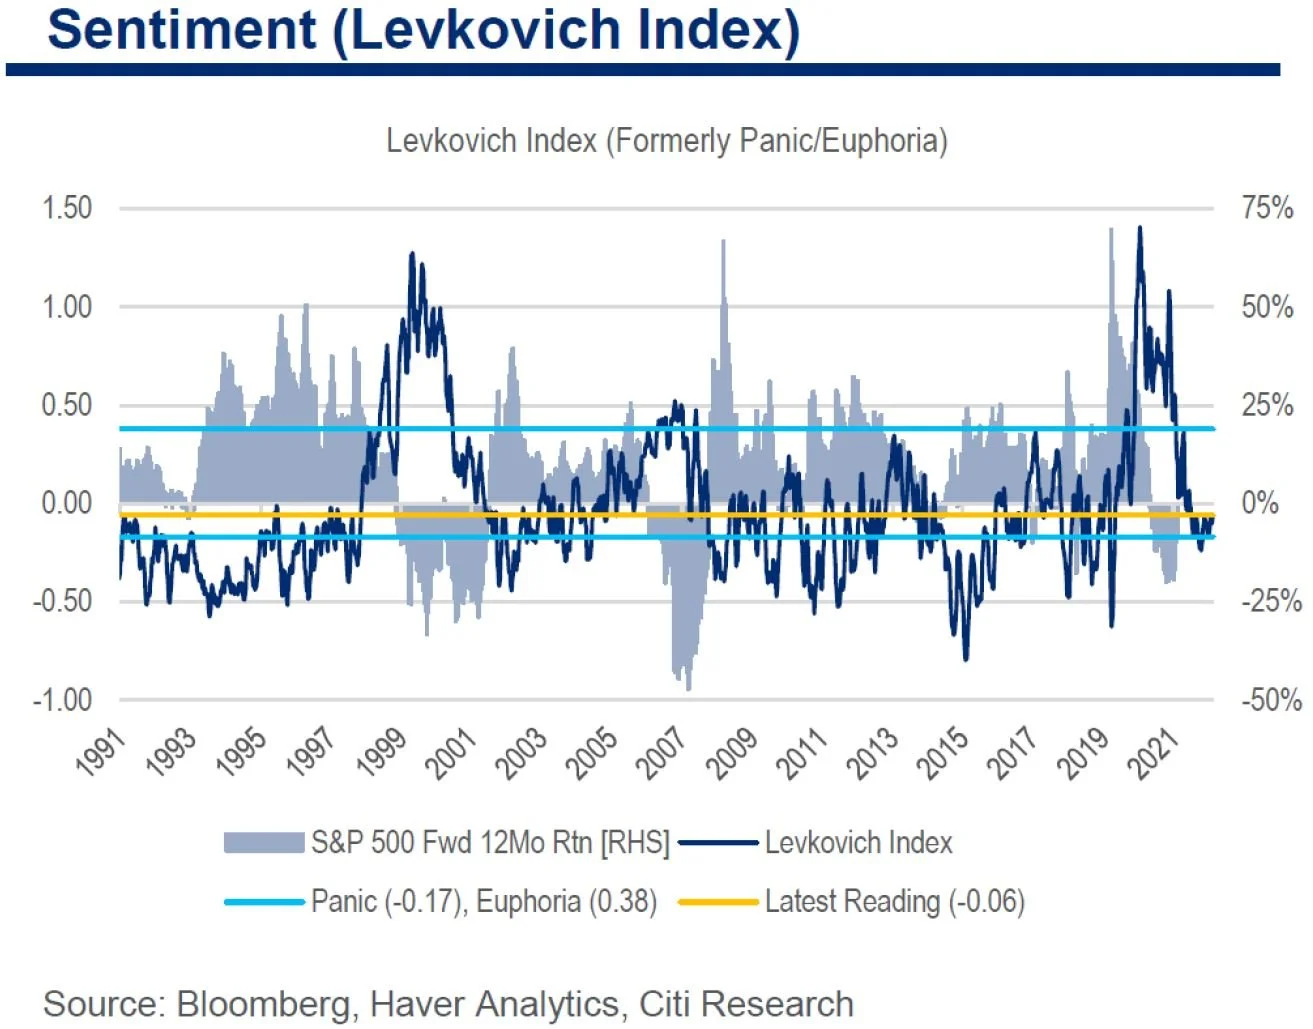
However, on the flip side, investor sentiment remains extremely negative even after the year-to-date bounce (Appendix D). According to the Levkovich Index (formerly Panic/Euphoria), its current reading of -0.06 is associated with a 91% likelihood of positive 12-month forward returns for equities, according to the model.
Financial markets have been dominated by two distinct macroeconomic shocks over the past three years: the gargantuan fiscal response to COVID-19 followed by one of the fastest rate hiking cycles in history. Correlation between individual equities was strong and returns were largely dictated by sector/factor exposure. Going forward, assuming inflation begins to stabilize, we believe microeconomic factors could finally take the reigns.
A potential return of the stock picker’s market would make sense in a broader context as well. As we have written about in the past, SMID cap companies tend to be the leaders at the beginning of a bear market, while the prior cycle’s market leaders tend to be the last ones to feel pain. Plenty of carnage took place in beneath the surface in 2021 before the “FAANGMT” stocks were finally crushed in 2022.
In our opinion, there are many SMID caps that have been battered for two years and appear cheap on an absolute basis, even if earnings expectations are too high. Market leaders during the early innings of a bear market are also the outperformers during the first innings of the subsequent bull market. Even if we are not in a secular bull market like the 2010s, it’s worth noting picking individual stocks worked well post-Dom-com bubble burst in the early-to-mid 2000s and strong investment returns were made during a prolonged choppy sideways period.
All of this is a long-winded way of saying the following. We expect a wide dispersion in reported results going forward. This is not a macroeconomic environment where every company beats or misses. Some companies will grow, others won’t. Some companies will increase guidance, others will cut. Some stocks will go up, some will go down. Again, we expect a more favourable environment for stock picking as the year progresses.
We prefer to own business that have a healthy combination of pricing and volume growth, possess pricing power, have high switching costs, contractual revenue streams, etc. We are intentionally avoiding businesses with overleveraged balance sheets, especially those which are scheduled to re-finance outstanding debt at much higher rates. A combination of demand erosion, operational deleveraging, and higher interest payments is a recipe for earnings to pancake.
We felt that market dynamics began to normalize for potential short positions in the back half of last year. Overvalued and overly promotional companies went down a lot. Companies that performed poorly went down as well. Air began to seep out of obvious bubbles. And then, suddenly, January felt like the meme stock bubble all over again. Short selling became a source of tremendous pain as many of these frothy stocks doubled or tripled within weeks. Although some rationality has returned to markets, we remain cautious with our short book.
PORTFOLIO UPDATE
The Fund entered this calendar year less net invested relative to last year, given we exited a couple of our core long positions, have yet to replace them, and added a handful of short positions during the year. Our short positions modestly contributed to overall performance last year but have been a detractor year-to-date.
Our intention is to patiently increase both gross and net exposures as opportunities present themselves throughout the year. Our base case is volatility is likely to remain elevated and flexibly deploying capital can allow us to take advantage of big price swings and sentiment extremes, especially if the market environment becomes more favourable for stock picking. This may result in the Fund trading more often relative to the previous few years.
LOOKING BEYOND 2022
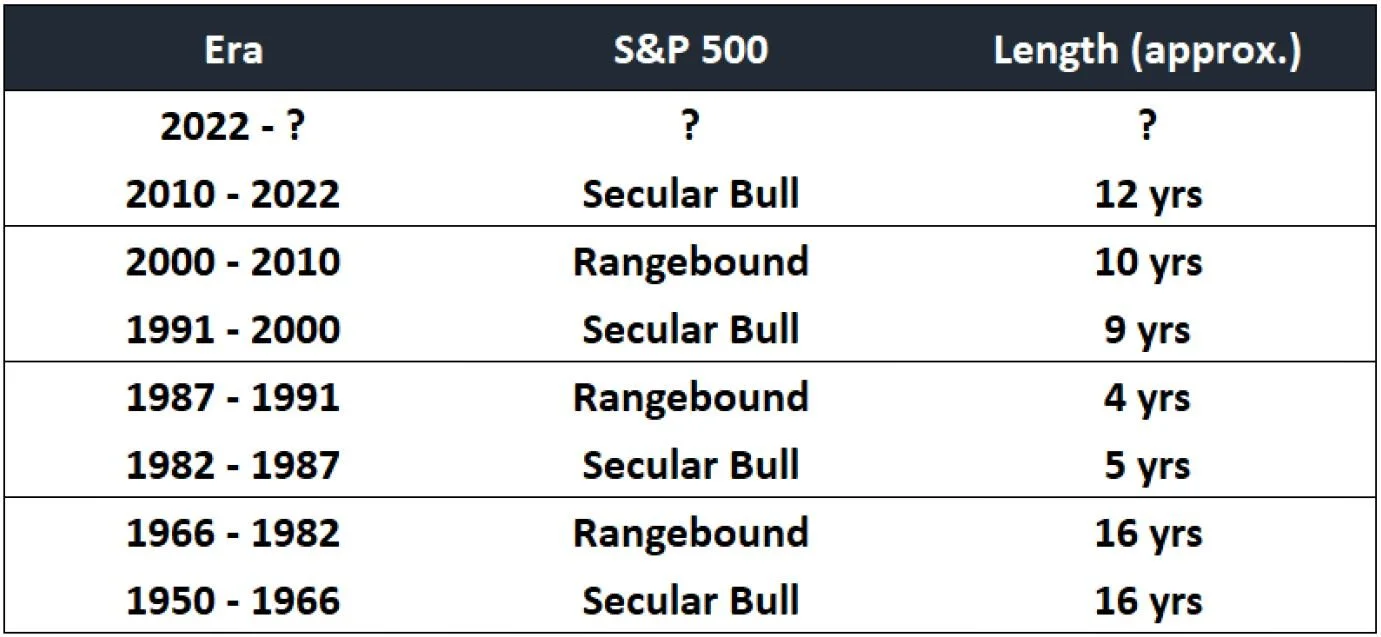
Our base case for the next decade remains unchanged. We believe the stock market will trade in a choppy sideways environment for many years. Time is the cost of malinvestment, which was significant during this latest market cycle, so it’ll take a long time to normalize afterwards. Historically speaking, every secular bull market has been followed by a matching rangebound period of similar length (Appendix E).
Overvaluation means the prospects for strong investment returns are below their historical norms. It makes intuitive sense that an era of pulling forward future gains results in a proportionate era of weak returns such that over the course of an entire long-term market cycle the annualized rate of return roughly matches the cost of equity.
In our opinion, the tenets of future investment success will be very different than what worked over the past ten years. Trading in a wide sideways band for a long time will present tremendous opportunities but they will have much different characteristics than the typical buy-and-hold strategy that benefited from the strong rising tide in the 2010s. Generating 10%+ annualized returns with minimal volatility and negligible drawdowns is unlikely to repeat throughout the 2020s, in our view.
Sincerely,