FY 2023
Kinsman Oak Investor Letter FY 2023
February 26, 2024
Click here to download the PDF version
REVIEW OF 2023 & PREVIEW OF 2024
In a lot of ways, last year was the opposite of the one preceding it. Sentiment was overwhelmingly bullish as we entered 2022 and investors were eager to see just how high equities could climb. Meanwhile, the market bombed, and many were badly bruised by massive drawdowns. After twelve months of down-and-to-the-right price action, sentiment was overwhelmingly bearish at the beginning of last year and pretty much every economist with a pulse was forecasting an imminent recession. So, of course, the stock market delivered strong returns.
While the S&P 500 remained in positive territory all year, there were a couple of bumps and a few caveats along the way. The Federal Reserve was determined to hike interest rates until something in the financial system broke, and they did exactly that. Silicon Valley Bank went from a thriving institution in its natural habitat to a taxidermized trophy on Jerome Powell’s desk within five days.
A few other regional banks met the same fate shortly thereafter, but most were still breathing when the dust settled. Turns out the rapid rise in interest rates ultimately did not have the widespread cataclysmic impact that most were anticipating. There was no systemic crisis, earnings did not collapse, and valuation metrics did not implode. Massive fiscal spending and gargantuan budget deficits appear to be offsetting any potential economic headwinds resulting from tighter monetary policy.
Stock market returns were largely driven by multiple expansion for the “Magnificent 7” which were up between 48% - 239%. While the S&P 500 was up 26% on the year, 72% (!) of its constituents underperformed the index. This enormous concentration in return contribution and index weightings is worthy of a more detailed discussion which is explored further below. By comparison, returns for the equal weighted S&P 500 and the Russell 2000 were negative through the first ten months of the year which brings us to our next topic.
Last year was a tale of two chapters. Chapter one – the first ten months – where a handful of mega-cap technology stocks carried the index higher while everything else was down mid-single-digits. Chapter two – the last two months – where the Federal Reserve pivoted, and a broad-based euphoric rally ensued. The Fed’s dot plots revealed three rate cuts in 2024 so, naturally, the market priced in six and investors were clamouring to buy anything that was publicly listed. According to State Street, ETFs experienced inflows of $135 billion last December, the highest single month on record, which suggests performance-chasing behaviour was extreme.
Goldilocks Is the New Soft Landing
The most fashionable word in macroeconomics lately has been “Goldilocks.” Investors, after witnessing the rally over the past few months, are taking a celebratory victory lap as if Jerome Powell hit a walk-off grand slam. Consensus expectations anticipate the perfect combination of declining inflation, moderate economic growth, and interest rate cuts to support asset prices – none of these metrics are too hot, or too cold, but just right. In our view, current valuations reflect the most immaculate of landings.
While we acknowledge this overly optimistic scenario is quite possible, we can’t help but recognize the stunning irony in the analogy. Those who have read the story of Goldilocks will remember how it ends. Goldilocks arrives at the house, eats some porridge, sits in the chairs, and then, feeling a little too comfortable, she takes a snooze. Shortly thereafter the bears come back home, and Goldilocks skedaddles out of an open window never to be seen again. The analogy used to describe the bullish thesis has literal bears who show up late and end the party.
We believe the moral of the story is investors should never get comfortable enough to grab some shut eye. It is our belief that more caution is warranted, and more rigorous risk management is needed, when sentiment has swung too far to the euphoric side of the boat. We don’t see any specific imminent risks that could upend the Goldilocks scenario at this juncture, but soft landing hopes are typically widespread before recessions begin, so the absence of an obvious time bomb doesn’t provide a lot of comfort. Given the backdrop of expensive valuations and extreme sentiment, we prefer to pay close attention for potential warning signs.
Inflation has certainly come a long way over the past couple of years (peaked at 9.1% in June 2022 compared to 3.1% in January 2024), but still stubbornly remains above the Fed’s 2% target and is beginning to appear sticky. Over the past eight months, the year-over-year inflation rate has hovered between 3.0% - 3.7%, suggesting the rapid deceleration from high-single-digits might be stalling out. The echoes of unprecedented (and continued) fiscal stimulus are still reverberating through the economy. The psychological component from accumulated inflation thus far has created a reflexive relationship where rising prices beget rising prices.
Analyzing this economic cycle has been particularly challenging due to the sheer magnitude of government intervention since the pandemic began. Economic indicators remain strong, but the numbers are grossly obfuscated and distorted by unprecedented fiscal deficits, making it impossible to know what the real economy would look like without it. Thus, forecasting where inflation ultimately levels out – whether low-single-digits or mid-single-digits – cannot be done with a high degree of confidence.
And Then There Was One
We are currently experiencing one of the narrowest equity market rallies in history. The monumental outperformance of the “Magnificent 7” stocks – Apple (AAPL), Alphabet (GOOG), Amazon (AMZN), Meta Platforms (META), Microsoft (MSFT), NVIDIA (NVDA), and Tesla (TSLA) – was a memorable hallmark of 2023 (Appendix A). The average return on this basket of seven was +111.3% last year compared to +26.3% for the S&P 500 and +13.8% for the S&P 500 Equal Weighted index.
Detailed performance attribution for the +26.3% S&P 500 total return is as follows. The Magnificent 7 accounted for +15.32% and the top 25 biggest contributors added +21.04%. This means the remaining 475 companies in the index combined for a measly +5.25% gain (Appendix B). As we enter this year, the index remains heavily concentrated in seven companies which comprise ~30% of the S&P 500 market capitalization by weight.
Investors are beginning to draw parallels to the dot-com bubble. Shared characteristics include the high degree of concentration risk among the ten top holdings while that same handful of stocks are responsible for generating most of the index-level returns. The hype around AI can be compared to the internet narrative back then. The lesson learned was technological innovation cannot be implemented overnight and commercial success is not guaranteed, even for the most innovative of companies. Rewards reaped may come years or even decades from when cutting-edge breakthroughs take place.
Another characteristic associated with bubble conditions is that leadership breadth deteriorates the whole way up. The higher the market climbs, the closer it gets to the peak. As the market gets closer to its peak, the fewer number of stocks are responsible for driving the index higher. Eventually, the last one standing will disappoint expectations and, when that happens, look out below.
We are only two months into this calendar year and the Magnificent 7 have already been reduced to the Magnificent 4. AAPL, GOOG and TSLA are underperforming the S&P 500 on a year-to-date basis (-4%, +3%, and -20% respectively, versus SPY +7%). Clearly, market breadth continues to deteriorate as almost half of the leadership group are struggling. AMZN, META, MSFT and, of course, NVDA are still doing the heavy lifting (+15%, +38%, +9%, and +58% respectively).
Investors making the dot-com bubble comparison will point to NVDA and CSCO. Cisco peaked only one trading day after the Nasdaq did. Their revenue growth rate slowed but didn’t fall off a cliff, and earnings didn’t implode either. The bubble burst when investors realized they overestimated growth rates across the sector. The fascination with artificial intelligence has been around for generations. It’s obviously growing rapidly and will almost certainly enhance productivity, change industry dynamics, and so on. But, at some point, the hype gets overblown, and the anticipated growth rate becomes unrealistic. That expectations reset can be ugly.
A combination of higher financial and operating leverage, the prevalence of passive investing, slower economic growth rates, higher government indebtedness, demographic changes, etc. introduces additional layers of risk when comparing today’s environment to the dot-com bubble. One mitigating factor worth noting is the valuations for the top ten S&P 500 constituents appear far less demanding given forward growth expectations relative to the insanity experienced during the dot-com bubble.
Another legitimate counterargument is that leadership changes and rotates quite frequently. Perhaps the market will continue its march upwards-and-to-the-right, and by this time next year we’ll have a brand-new acronym to discuss. That would require other stocks to outperform and take the mantle from the stragglers in the original Magnificent 7. In our opinion, the absence of a convincing rotation is a real risk worth paying attention to.
C.R.E.A.M.
Last year marked the 30th anniversary of the release of the song “C.R.E.A.M.” written and performed by the Wu-Tang Clan. While neither the song nor the album containing it were immediately successful, the backronym “Cash Rules Everything Around Me” became quite famous. As time passed, the song was eventually recognized by multiple publications as one of the greatest hip-hop songs of all time, and the iconic phrase has often been referenced outside of hip-hop. For instance, Dave Chappelle released a skit called “Wu-Tang Financial” nine years later and, most recently, Miley Cyrus released a song called “D.R.E.A.M.” five years ago featuring Ghostface Killah, one of the original members from the Wu-Tang Clan.
The policy response to the Great Financial Crisis ushered in the era of TINA (There Is No Alternative). For a long time, investors were pushed further out the yield curve to generate adequate nominal returns. We’ve discussed the consequences of that ad nauseum and rehashing it here would be unnecessarily repetitive. Over the past two years, however, we have entered the CREAM era. For the first time in more than a decade investors were able to earn non-zero yields in U.S. Treasuries and investment grade fixed income securities.
Yield-bearing instruments are now legitimate alternatives for savers and could potentially have profound implications for asset allocation if this dynamic persists. Equity valuations on an absolute and relative basis appear stretched and, consequently, stocks now offer the narrowest equity risk premium relative to the 10-Year Treasury notes in recent memory. In fact, savers earn 400 basis points more by investing in 3-Month Treasury bills relative to the dividend yield on the S&P 500 (Appendix C). The S&P 500 has historically provided an annualized return of ~10% and investors are able to capture more than half of that prospective return in a risk-free instrument.
Given long-term demographic shifts and the wave of retirements post-pandemic, there are now more retirees relying almost solely on income generated by their 401(k) or RRSP accounts compared to 2007, which was the last time the spread between 3-Month Treasury bills and the S&P 500 dividend yield was this wide. Should interest rates remain higher for longer, and valuations remain elevated as well, we may see a structural shift towards fixed income which may cause persistent selling pressure on equities.
WHERE WE SEE OPPORTUNITY
In our opinion, there are clearly macroeconomic risk factors worth monitoring and borderline euphoric sentiment suggests markets may be slightly overextended. However, we believe there are fundamental reasons to be optimistic on certain companies and sectors over the next few years. Said differently, while we remain concerned about top-down risks, we are constructive on the bottom-up opportunities available right now.
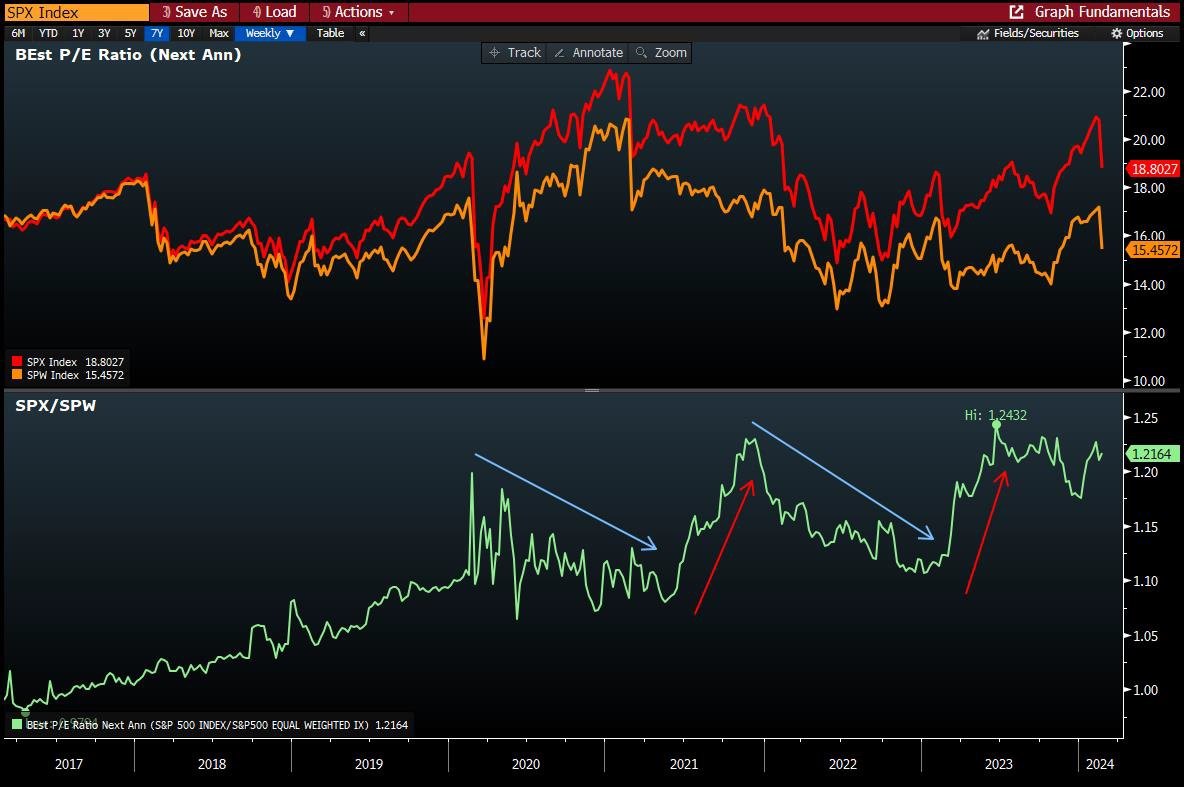
First and foremost, the valuation premium placed on the S&P 500 Index (SPY) versus the S&P 500 Equal Weighted Index (SPW) is close to seven-year highs. If history is any indicator, this spread will eventually normalize, meaning the S&P 493 should eventually outperform the Magnificent 7. It seems impossible to imagine right now, especially given NVIDIA’s recent parabolic move post-earnings, but tipping points usually occur when the consensus deems the prospect of a trend reversal unimaginable (Appendix D).
Further, valuations are far less demanding if you remove the mega-cap technology companies. Both the S&P 500 Equal Weighted Index (SPW) and the S&P Smallcap 600 Index (SML) trade for ~15.5x EPS, which are in line with historical multiples. The obvious outlier is the Russell 2000 (RTY) which has skyrocketed from ~18x EPS in October 2023 to ~25x EPS today (Appendix E). This suggests high-beta, low-quality companies experienced outsized rallies driven by multiple expansion, so we suspect there might be quite a bit of garbage propping it up.
We highlighted our thoughts on cannibals last quarter, and we continue to favour these cash flow machines that use the proceeds to repurchase shares in the open market. We have recently initiated a starter position in an energy company that is expected to generate meaningful free cash flow over the next few years and is determined to buy back a meaningful percentage of their shares outstanding. Our thesis is more about capital allocation and poor sentiment across the sector than a direct bet on the price of oil.
In fact, to describe the sentiment towards the sector as poor would be a tremendous understatement. Investors are clamouring to bid up anything and everything even remotely involving artificial intelligence. Commodities and other hard assets are seemingly neglected and out of favour. To put it in perspective, NVIDIA now has a larger market capitalization than the entire S&P 500 Energy sector combined. We do not plan on having significant oil and gas exposure given our circle of competence but it’s an observation worth noting.
We continue to own Colliers International Group (CIGI). We recognize commercial real estate as an asset class is in a precarious state. Obviously, there is a big difference between top-tier and lower-tier assets, so this discussion is a blanket generalization. The headwinds are as follows. Office vacancies remain elevated as leases expire. Some element of work from home appears here to stay and employers continue to shrink their office footprint. Expenses associated with property management are climbing with inflation, yet rents are decreasing due to less demand, decimating the unit economics. Exacerbating this squeeze is the amount of operating and financial leverage on these properties. Most importantly, rising interest rates are hitting this sector hard. Refinancings will take centre stage this year and lower appraisal values will require owners to put up more capital to maintain the same loan-to-value ratio and, on top of that, the new interest expense will likely be a lot higher going forward.
The plethora of headwinds for commercial real estate are known knowns and many property owners will inevitably find themselves underwater when it comes time to refinance. The lucky ones will take some lumps and bruises but make it out the other side. Others will declare bankruptcy and let the lenders take possession of whatever assets were collateralizing the debt. But Colliers does not have this kind of direct exposure and the business is not as dependent on commercial real estate asset values as meets the eye. In fact, 59% of revenues and 73% of Adjusted EBITDA are considered recurring. Colliers financial performance appears to have troughed last year, and the company recently provided guidance for next year implying a return to strong growth.
Markets have had one big down year followed by one big up year, and prices seem fully valued. Stocks have moved in baskets for the past two years and we anticipate more dispersion going forward. This may present an interesting opportunity to pair trade which is something we typically do not engage in. Either way, we will evaluate potential new positions based on unique stock-specific theses instead of seeking to gain exposure to certain sectors, factors, or underlying thematic themes.
LOOKING BEYOND 2024
We have often written that our expectation for the next decade can be concisely described as violently rangebound. Perhaps we should have specified prospective returns would be underwhelming in real terms. This cycle has been unusual relative to historical standards which makes forecasting, an already futile endeavour, even less valuable. Uncontrolled fiscal spending and ballooning deficits in supposedly good economic times should prove unsustainable to say the least, and probably moves us closer to the convergence of monetary and fiscal policy. We are in an election year so fiscal restraint is unlikely, and both leading candidates are exorbitant spenders. Regardless of who wins, the national debt is probably set to climb higher without end in sight.
The yield curve has been inverted since November 2022 and we have yet to enter recession. The economic data is mixed, and investors can find concrete statistics to support their preferred conclusion. In our view, every positive data point can be met with a negative counterpoint. For example, if you want to be bullish you can find refuge in the low unemployment rate. If you’re bearish, you can point to the below trend labour force participation rate. Inflation has fallen, yet parts of those inflation figures remain stubbornly sticky.
The point is that this has been an extremely weird cycle and there are a lot of strong crosscurrents. It’s difficult to ascertain where everything levels out. Either way, it is our belief the easy money was made in the 2010s and the 2020s will probably not be as smooth sailing. Even if gains are made, we anticipate more volatility along the path to get there. Going forward, we will continue to pay close attention to overall sentiment and gauge investor positioning when attempting to enhance performance. These upcoming years will likely have more than a few curveballs and we hope to use any volatility to our advantage.
Sincerely,